Introduction to RMS Wavefront Error
As mentioned in several articles in this blog, aberrations are of great relevance when designing an optical system. The objective being to design a system that creates a “good image”. However, there are different metrics to evaluate what is a “good image”. Most of the time, a customer won’t express their image quality requirements in terms such as MTF or ray aberration plots. However, they know what they want the optical system to do. It is up to the optical engineer to translate those needs into a numerical specification. Some aberration measurement techniques are better for some applications than for others. For example, for long-range targets where the object is essentially a point source like in a telescope, RMS wavefront error might be an appropriate choice for system evaluation.
RMS (Root Mean Square) Wavefront Error stands as a pivotal metric in the realm of optical systems, serving as a quantitative measure of wavefront aberration. At its essence, this metric provides a numerical representation of how closely the real wavefront of an optical system aligns with a perfect spherical wavefront.
The calculation involves comparing the real wavefront deviations with an ideal reference, utilizing a formula that encapsulates the statistical average of squared deviations. The result, expressed as the square root of the difference between the average of squared deviations and the square of the average deviation, succinctly quantifies the optical imperfections across the entire wavefront.
The importance of RMS Wavefront Error lies in its role as a key indicator of optical system performance. In applications such as telescopes, cameras, and laser systems, minimizing wavefront aberrations is essential for achieving optimal image quality, resolution, and overall system efficiency. A lower RMS Wavefront Error corresponds to a more accurately corrected optical system, ensuring clearer and sharper imaging.
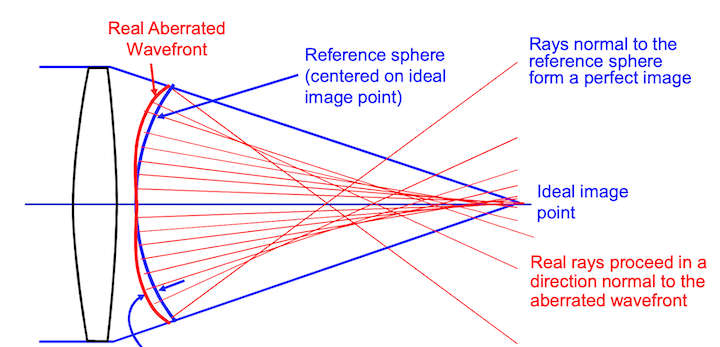
Wavefront aberration refers to deviations from an ideal optical wavefront, manifesting as distortions or imperfections in the way light waves propagate through an optical system. These aberrations can adversely impact image quality and the overall performance of optical instruments, making their understanding and measurement crucial in the field of optics.
Types of Wavefront Aberrations:
Spherical Aberration:
Occurs when parallel rays of light converge at different points, resulting in blurred images and reduced clarity.
Coma:
Causes off-axis light rays to focus at different distances from the optical axis, leading to comet-shaped distortions in images.
Astigmatism:
Results in different focal points for rays in different planes perpendicular to the optical axis, causing distorted images.
Chromatic Aberration:
Arises due to the dispersion of light into different colors, causing colored fringes around objects.
Zonal Aberrations:
Irregularities in specific zones of the optical system, contributing to overall wavefront distortions.
Measurement of Wavefront Aberration:
Several methods are employed to measure wavefront aberration, providing valuable insights for optical system characterization and optimization:
Interferometry:
Utilizes interference patterns between the ideal and distorted wavefronts to quantify aberrations. Common techniques include Twyman-Green and Michelson interferometers.
Shack-Hartmann Wavefront Sensors:
Divides the incoming wavefront into an array of small lenslets, measuring the local slope of the wavefront by observing the displacement of focal spots.
Fringe Analysis:
Involves analyzing interference fringes produced by the interference of a reference wavefront and the distorted wavefront.
Phase Retrieval Methods:
Deduces wavefront information by analyzing intensity patterns obtained through various algorithms.
When calculating the wavefront error, the reference sphere is centered on the “expected” image location (usually the image surface location of the chief ray). It may be that a different reference sphere will fit the actual wavefront better. If the center of the better reference sphere is at a different axial location than the expected image location, there is a “focus error” in the wavefront. If the center of the better reference sphere is at a different lateral location than the expected image location, there is a “tilt error” in the wavefront
RMS Wavefront Error in Zemax
Ray trace programs will report “Wavefront Errors” at the Exit Pupil of a system. The errors are the difference between the actual wavefront and the ideal spherical wavefront converging on the image point. In a system with aberrations, rays from different positions in the exit pupil may miss the ideal image position by various amounts when they reach the image plane. This is known as “Transverse Ray Aberration”, or ‘TRA’.
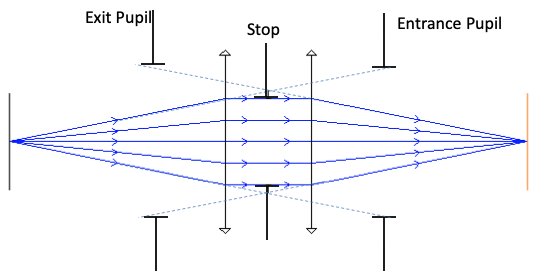
Zemax does not normally propagate waves through an optical system but rather uses a geometric relationship between Ray errors and wavefront errors to calculate the wavefront error map. Since rays are always perpendicular to wavefronts, a wavefront tilt error (at some location in the pupil) corresponds directly to a Transverse Ray error (TRA) at the image plane. By tracing a number of rays through the pupil,and measuring the TRA of each, we can get the slope of σ; then by numerical integration, we can find the wavefront aberrations, Zemax generates a wavefront map that visually represents the wavefront error across the optical system.The wavefront map illustrates the spatial distribution of aberrations, and the RMS value provides a quantitative measure of the overall wavefront error.
Analyzing RMS Wavefront Error:
Results Windows:
- Zemax provides results windows where users can view and analyze various optical parameters, including RMS wavefront error.
- Results can be displayed for specific surfaces, wavelengths, or field points, allowing a detailed examination of system performance.
Tolerance Analysis:
- Zemax facilitates tolerance analysis to assess the impact of manufacturing variations on the RMS wavefront error.
- Users can perform sensitivity analyses to understand how changes in component parameters affect the overall system performance.
Ray Tracing and Spot Diagrams:
- Ray tracing capabilities in Zemax enable users to visualize the path of rays through the optical system.
- Spot diagrams show the image quality at different field points, helping to identify and understand the impact of aberrations on image formation.
Optimization:
- Optical designers use Zemax’s optimization tools to iteratively improve system performance.
- By adjusting parameters and observing changes in the RMS wavefront error, designers can fine-tune optical systems for optimal results.
Measuring Wavefront errors in real systems
There are different ways to measure the wavefront distortions introduced by an optical system. We can use interferometric methods, however these may be limited to the use of coherent light (like a laser). Shack-Hartmann wavefront sensors can work in incoherent and even broad-band light. A Shack-Hartmann wavefront sensor consists of an array of micro-lenses focusing portions of an incoming wavefront onto position-sensitive detectors.
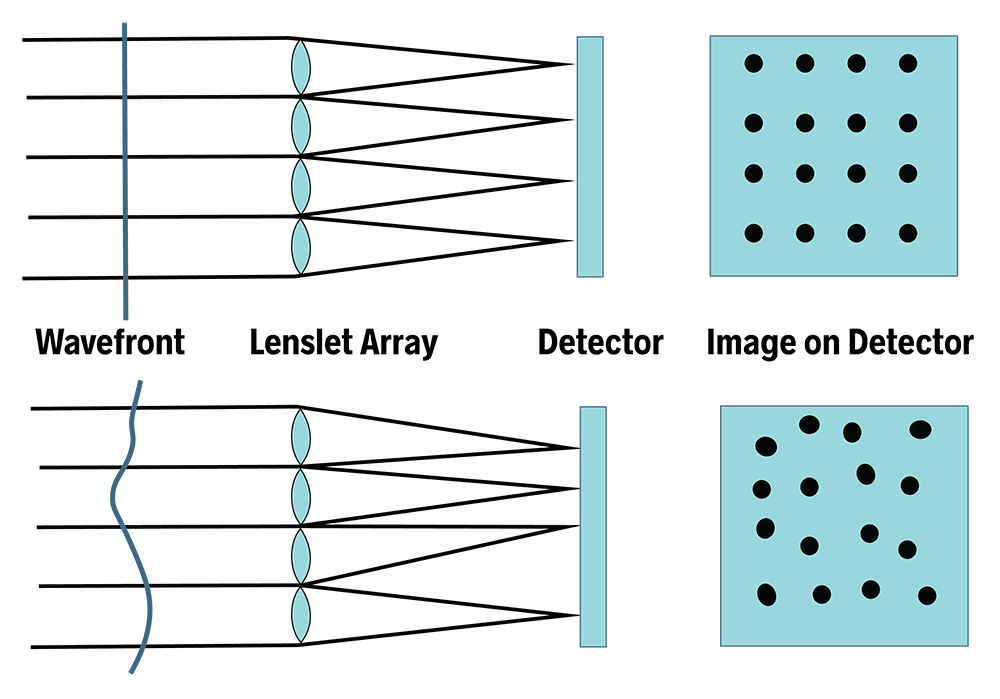
Figure 3. Example of wavefront error Shack–Hartmann sensors are used in astronomy to measure telescopes and in medicine to characterize eyes for corneal treatment of complex refractive errors
Importance of Understanding and Correcting Wavefront Aberration:
The practical applications of accurate measurement of wavefront aberrations extend across diverse fields, notably in astronomy and medicine, where precision is paramount. In astronomy, telescopes and observational instruments heavily rely on minimizing wavefront aberrations to capture clear and detailed images of celestial objects. Accurate measurement is crucial for deciphering the secrets of the universe, as even minute distortions can compromise the quality of astronomical observations. In the medical field, precise measurement and correction of wavefront aberrations play a pivotal role in procedures such as laser eye surgeries. Achieving optimal visual outcomes requires a thorough understanding of aberrations and their correction, enhancing the precision and safety of these medical interventions. In both disciplines, the significance of accurate measurement lies in the ability to push the boundaries of exploration and discovery, whether gazing at distant galaxies or ensuring the well-being of patients through advanced medical treatments.
Image Quality:
- Minimizing wavefront aberrations enhances image quality by reducing distortions and improving clarity.
Optical System Performance:
- Achieving optimal performance in devices like cameras, telescopes, and microscopes requires careful correction of aberrations.
Medical and Industrial Applications:
- Correcting wavefront aberrations is critical for precision and accuracy in applications such as laser eye surgery and industrial laser systems.
Scientific Research:
- In fields like astronomy, understanding and compensating for wavefront aberrations are essential for obtaining accurate observations and measurements.
Real-World Examples of Crucial RMS Wavefront Error Measurement:
- Astronomy – Hubble Space Telescope: The Hubble Space Telescope stands as an iconic example where RMS wavefront error measurement played a pivotal role. After its launch in 1990, a flaw in its primary mirror was identified, causing spherical aberration. Engineers utilized precise RMS wavefront error measurements to characterize and quantify the aberration, ultimately devising corrective optics to enhance the telescope’s imaging capabilities. This successful intervention showcases the critical importance of accurate wavefront error measurement in the realm of space exploration.
- Medical Laser Surgery – LASIK Procedures: In the field of ophthalmology, particularly in LASIK (Laser-Assisted In Situ Keratomileusis) procedures, precise measurement and correction of wavefront aberrations are paramount. High-precision laser systems utilize RMS wavefront error data to customize the laser ablation patterns, ensuring optimal reshaping of the cornea for vision correction. Accurate measurement contributes to the success of these surgeries, enhancing visual outcomes and minimizing postoperative complications.
- Microscopy – Super-Resolution Microscopes: In advanced microscopy techniques like super-resolution microscopy, where researchers aim to visualize cellular structures at nanoscale resolutions, minimizing wavefront aberrations is critical. Accurate RMS wavefront error measurement guides the design and optimization of these microscopes, enabling researchers to achieve unprecedented clarity and detail in imaging subcellular structures. This has far-reaching implications for understanding cellular processes and advancing biomedical research.
- Laser Systems in Manufacturing – Precision Machining: In industrial applications such as precision machining and laser material processing, minimizing wavefront aberrations is essential for achieving high-precision results. Laser systems with low RMS wavefront error ensure precise focusing and uniform energy distribution, contributing to the accuracy and efficiency of processes like cutting, welding, and engraving in manufacturing.
- Space-based Communication – Deep Space Probes: Deep space probes and communication satellites rely on accurate wavefront error measurements to optimize their optical systems. In the vastness of space, where communication signals travel over considerable distances, minimizing aberrations becomes crucial for maintaining the integrity and strength of signals. Precise RMS wavefront error analysis ensures that optical components perform optimally, enhancing the reliability of space-based communication systems.
These real-world examples underscore the significance of RMS wavefront error measurement in a diverse range of applications, from exploring the cosmos to advancing medical procedures and optimizing industrial processes. The ability to quantify and correct wavefront aberrations continues to be a driving force behind technological advancements in various fields.
Conclusions
In conclusion, understanding RMS wavefront error in optical design emerges as a cornerstone for achieving excellence in diverse applications. This metric serves as a quantitative measure of wavefront aberrations, allowing optical designers to assess and optimize the performance of optical systems. From the intricacies of telescope observations to the precision of medical laser surgeries and the nanoscale realms of super-resolution microscopy, accurate measurement of RMS wavefront error plays a pivotal role. Real-world examples, such as the Hubble Space Telescope’s corrective optics and the success of LASIK procedures, underscore the tangible impact of minimizing aberrations for enhanced outcomes. The value lies not only in the ability to quantify imperfections but also in the capacity to implement corrective measures, pushing the boundaries of optical technology. As we continue to explore the cosmos, advance medical treatments, and refine industrial processes, the understanding and management of RMS wavefront error remain fundamental for achieving clarity, precision, and innovation in optical design.
FAQ About RMS Wavefront Errors in Real Systems
What is RMS Wavefront Error and why is it important in optical systems?
RMS Wavefront Error is a measure used to quantify the deviation of an optical wavefront from an ideal shape. It’s crucial in optical systems for evaluating image quality and overall performance.
How is RMS Wavefront Error measured in real optical systems?
In real optical systems, RMS Wavefront Error is typically measured using interferometric methods or Shack-Hartmann wavefront sensors, which can accommodate various light conditions including incoherent and broad-band light.
Can RMS Wavefront Error be used in all types of optical systems?
While RMS Wavefront Error is a versatile metric, its applicability depends on the specific requirements of the optical system, such as the nature of the target object and the desired image quality.
- NIST Publication on RMS Wavefront Error: Estimating the RMS of a Wavefront and Its Uncertainty.
- Wavefront Error Analysis in Zemax: Wavefront Error Analysis in Zemax.
- Understanding Strehl Ratio & Wavefront Error for Optical Systems Delve into the complexities of Strehl Ratio and Wavefront Error in optical systems. Learn how these metrics are essential in evaluating and enhancing optical performance.
- Abbe Sine Condition Explore the fundamental principles of the Abbe Sine Condition and its impact on optical system design. Understand its role in minimizing aberrations and improving image quality.

